A useful monthly SEO report explains what changed, what the evidence supports and what the team should do next. Impressions, clicks and rankings help describe search performance, but a table of rising numbers is not a complete report. Readers also need the comparison dates, filters, business outcomes and the limits of the data.
This guide includes an editable report template and a filled illustrative example. It complements how to measure SEO results, which explains the broader measurement strategy. Here, the focus is assembling a repeatable monthly deliverable.
Key takeaways
- Record the property, dates and filters before comparing results.
- Keep Search Console clicks separate from GA4 sessions and key events.
- Calculate CTR from total clicks and impressions, not average row percentages.
- Give each recommendation an owner, supporting evidence and review date.
Table of contents
- Download the monthly SEO report template
- Step 1: Define the dates, audience and search scope
- Step 2: Build an executive summary someone can act on
- Step 3: Calculate clicks, impressions and CTR correctly
- Step 4: Add GA4 sessions and meaningful outcomes
- Step 5: Find query-to-page opportunities
- Step 6: Explain declines without inventing causes
- Step 7: Turn recommendations into an action log
- Frequently asked questions
- Build your first report
Download the monthly SEO report template
Download the blank editable SEO report template and view the filled illustrative example. Both are plain Markdown documents. You can edit them in a text editor or adapt the headings and tables into your usual document tool. They are not connected to your analytics accounts and do not fetch data automatically.
The blank template includes:
- A reporting scope and data-quality checklist.
- An executive summary with evidence and uncertainty.
- Search Console and GA4 metric tables.
- Query-to-page opportunities and declining pages.
- Technical changes and known measurement issues.
- An action log with owners and review dates.
The example uses invented figures to demonstrate arithmetic and interpretation. It is not a client case study, a snapshot of bikeshtamang.com.np or a claim about expected SEO growth. Replace every example value before using it in a real report.
Start with the blank version and complete the scope section first. This avoids a surprisingly common reporting problem: copying the latest totals into an old report while leaving last month's filters or interpretation unchanged.
Step 1: Define the dates, audience and search scope
Record the exact start and end dates for the current and comparison periods. A calendar-month report can be useful for business planning, but two months can contain different numbers of days. A comparison of equal 28-day periods can help with weekday alignment. State which approach you chose and why.
For Search Console, record the property, search type, country, device and any page or query filter. For GA4, record the property, date range, session-based traffic filter and relevant key-event definitions. Include the extraction date so another person knows when the report was assembled.
Use separate sections for all-country performance and a target audience such as the United States. An improvement in worldwide impressions does not necessarily demonstrate improvement among US searchers. Similarly, a country filter in Search Console and a geographic dimension in GA4 are not interchangeable measurements of the same visit.
The Search Console Performance report documentation explains its available filters and metrics. Keep these settings consistent when comparing periods. If they change, state the change before interpreting the trend.
Also record site releases, campaigns, tracking changes and unusual outages. These notes provide context for investigation. They do not prove that a release caused a traffic change simply because the dates are close together. Use the technical SEO guide to organize the surrounding crawlability and implementation checks.
Step 2: Build an executive summary someone can act on
Write the summary after inspecting the evidence. A good version contains the observed result, the most useful explanation or unresolved question, and the next action. Avoid beginning with a generic paragraph about SEO being a long-term strategy.
For an illustrative report, a summary might read:
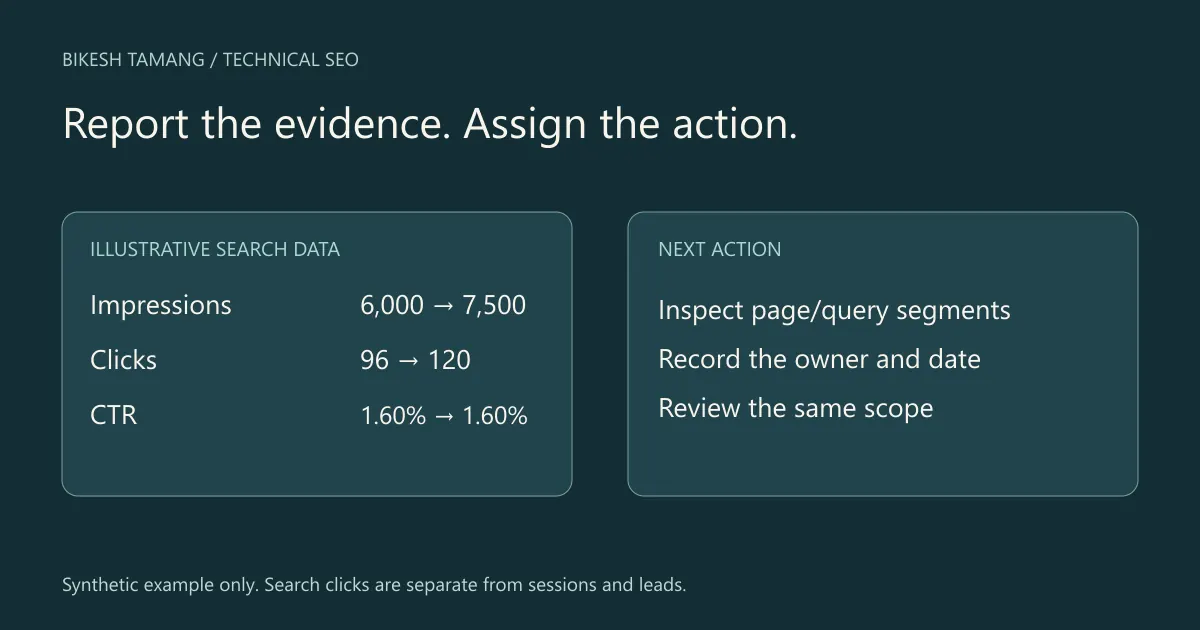
Over two equal 28-day periods, search impressions increased from 6,000 to 7,500 and clicks from 96 to 120. CTR remained 1.60%. The next review should identify which pages gained visibility and whether their queries match the intended audience. These invented totals demonstrate reporting logic; they are not actual site results.
That summary reports what the totals establish. It does not claim that titles improved, visitors were more qualified or a particular content update caused the increase. Those conclusions need additional evidence.
Separate facts from hypotheses in the template. A fact might be that a filtered page gained impressions. A hypothesis might be that broader query exposure explains its lower CTR. A next action might be to inspect the new queries and search appearance before editing the title.
Keep the executive summary short enough to read before the metric tables. The detailed sections should let a reviewer trace each statement back to its source, rather than introducing conclusions the tables cannot support.
Step 3: Calculate clicks, impressions and CTR correctly
Use the Search Console totals for the scope you recorded. Clicks describe clicks from eligible search results, impressions describe recorded appearances, and CTR is clicks divided by impressions. Definitions depend on the report and search appearance; Google's explanation of clicks, impressions and position provides the necessary context.
Here is the worked example supplied with the template:
| Metric | Previous 28 days, illustrative | Current 28 days, illustrative | Change |
|---|---|---|---|
| Impressions | 6,000 | 7,500 | +25% |
| Clicks | 96 | 120 | +25% |
| CTR | 1.60% | 1.60% | 0.00 percentage points |
The calculations are:
CTR = clicks / impressions × 100
Previous CTR = 96 / 6000 × 100 = 1.60%
Current CTR = 120 / 7500 × 100 = 1.60%
Click change = (120 - 96) / 96 × 100 = 25%
Impression change = (7500 - 6000) / 6000 × 100 = 25%
CTR change = 1.60% - 1.60% = 0.00 percentage points
Do not average the CTR percentages from several rows to produce the overall CTR. Use the corresponding total clicks and impressions. Likewise, do not sum overlapping filtered query groups and describe the sum as a deduplicated total.
When the previous value is zero, a percentage-change formula is undefined. Report the absolute change and explain the zero baseline instead of displaying an invented percentage. A movement from zero clicks to three clicks is three additional clicks; it is not a meaningful “infinite growth” headline.
Average position also needs care. It summarizes recorded result positions across the selected observations. It is not a fixed rank for every user or a simple statement that every query moved by the same number of places. Review a stable page/query segment before assigning a ranking explanation to a sitewide average.
Step 4: Add GA4 sessions and meaningful outcomes
Use GA4 to report what happens on the website after visits arrive. Choose session-scoped dimensions when discussing session acquisition. The GA4 Traffic acquisition report distinguishes this reporting scope from first-user acquisition.
Decide whether the report concerns all Organic Search traffic or Google organic traffic specifically. The Organic Search channel can include multiple search engines. A session source/medium filter such as google / organic has a narrower purpose. Label the choice rather than switching between them silently.
Include sessions and the specific outcomes relevant to the business. For a service website, that might be a validated inquiry event. For ecommerce, it might be transactions and revenue with a documented currency and tracking setup. A raw click on a contact link should not automatically be described as a qualified lead.
In the template, write the event name, what triggers it and the reason it matters. Check whether it fires once per intended action and whether internal testing or spam can inflate it. If you have not validated the event, report that limitation and assign a measurement action.
Do not expect Search Console clicks and GA4 sessions to match. They measure different things and depend on different collection, processing and attribution rules. Use each for its own question. A discrepancy is a reason to investigate configuration and scope, rather than overwrite one total with the other.
Keep business outcomes absent or marked unavailable when the data is not trustworthy. A report with a clearly stated tracking gap is more useful than a confident conversion narrative built on an unverified event.
Step 5: Find query-to-page opportunities
A useful SEO report identifies which page should address each opportunity. Begin with a relevant page or query segment, compare like-for-like periods and inspect the matching destination. The Search Console query-to-page analysis tutorial explains the investigation in more detail.
Use this working table:
| Field | What to record |
|---|---|
| Query or query group | The exact phrase or documented filter |
| Page | The URL currently appearing |
| Audience | Country and device scope |
| Evidence | Clicks, impressions, CTR and position for both periods |
| Intent | What the searcher appears to need |
| Proposed action | Update, consolidate, link, test a title or investigate |
| Review | Owner, implementation date and review date |
For a high-impression page with few clicks, inspect relevance, position and search appearance before assuming the description is the problem. Searchers may be seeking a different task, or the page may appear too low for a title change alone to make a substantial difference. The impressions but no clicks guide provides that diagnostic sequence.
Use regex filters to organize known query patterns, but preserve the exact expression used. A changed filter can create a changed result without any actual performance movement.
Search Console does not reveal every query. Google's performance overview explains that anonymized queries are omitted from query tables. A branded versus non-branded split based on visible queries is therefore an approximation, not a complete accounting of all searches.
Step 6: Explain declines without inventing causes
Separate an observation from an explanation. “This page lost clicks” is an observation. “The latest update caused the decline” is a causal claim. The second needs more evidence than a date comparison.
For a declining page, inspect technical availability, indexing signals, query mix, seasonality, competitor changes and changes to the site's own content or links. Google's search traffic drop debugging guidance gives a structured starting point.
Choose the next check based on the pattern. A loss of impressions on an unavailable page calls for a different response from stable impressions with lower CTR. A newly broadened query mix can change averages even when established queries are steady.
Avoid promising that restoring one setting or adding more posts will recover a particular traffic number. Put the strongest supported explanation first and retain unresolved alternatives in a short note. Assign a specific investigation rather than a vague instruction to “improve SEO.”
The monthly report should summarize technical findings and their effects. Keep the full issue inventory in your SEO audit report so that performance reporting does not become an unreadable checklist of every possible site issue.
Step 7: Turn recommendations into an action log
Give each action five things: evidence, a proposed change, an owner, a due date and a review method. This creates a record of what the team intended to test and what would count as useful progress.
For example, “Rewrite titles” is too broad. A more useful action is: “Review the title and opening section of the URL appearing for this relevant query group, document the change, and compare that same segment after a suitable observation period.” Do not promise an uplift before the change has been evaluated.
Use priority to reflect the issue and evidence. A public page returning the wrong status can warrant attention before polishing an already accurate meta description. A tracking problem that invalidates lead reporting can be more urgent than an additional dashboard chart.
Carry unresolved actions forward with their last update. Close an action only when its completion evidence is recorded. If an investigation disproves a hypothesis, preserve that result; it prevents the team from repeating the same unsupported recommendation next month.
Frequently asked questions
What should a monthly SEO report include?
Include the scope, an evidence-based summary, search visibility, website outcomes, important page/query changes, technical context and a prioritized action log. Adapt the detail to the decision-maker. Every chart should answer a question that matters to the website.
Should I use calendar months or 28-day comparisons?
Either can be appropriate. Calendar months align with many business reports; equal 28-day periods can make weekday comparisons simpler. Record the choice, the exact dates and any unequal period lengths. Do not mix the two without explaining it.
Is a lower CTR always bad?
No. CTR can change with position, query intent, search features and the mix of impressions. Investigate comparable page/query segments and relevant outcomes before deciding what to change. A sitewide percentage alone cannot identify the cause.
Does this template connect to Search Console automatically?
No. The download is an editable document. Enter verified values from your chosen reports and retain the underlying exports. It includes no account connection, hidden data collection or automatic forecast.
Build your first report
Download the template, document the filters and complete one reporting cycle using consistent definitions. End with a short action list that another person can carry out and review. For help connecting measurement findings to site improvements, see the SEO audit service.